
Financial Analysis Report has some basic financial ratio analysis to help company stakeholders understand how well the business is performing and potential areas that need improvement.
- Index To Reports – Accounts
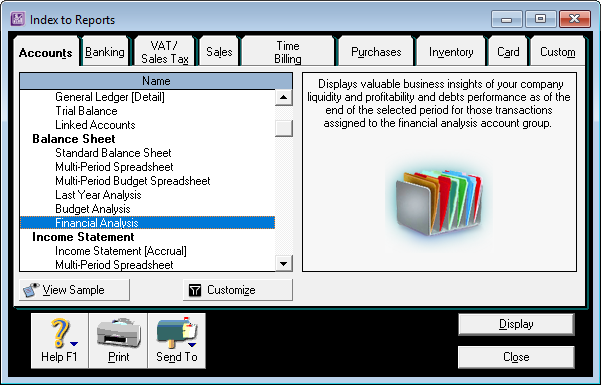
This report can be found at Index to Reports > Accounts > Balance Sheet: Financial Analysis. (Refers to IMG001)
IMG001
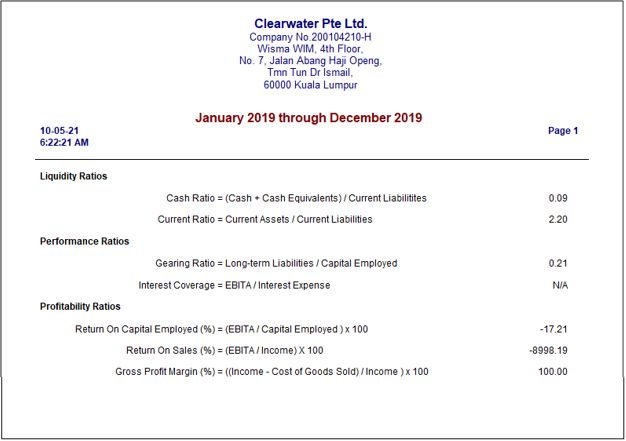
The sample report will look like this: (Refers to IMG002)
IMG002
There are three types of analysis provided in this report:
Liquidity Ratios
Cash Ratio
A liquidity ratio that measures a company's ability to pay off its current liabilities with only cash and cash equivalents.
Current Ratio
A liquidity and efficiency ratio that measures a company's ability to pay off its short-term liabilities with its current assets.
Gearing Ratio
A performance ratio shows the proportion of finance that is provided by debt relative to the finance provided by equity.
Performance Ratios
Interest Coverage
A performance ratio that measure the company's ability to meet its interest payments.
Return On Capital Employed % (ROCE)
A profitability ratio that measure the returns that a company is achieving from the capital employed.
Profitability Ratios
Return On Sales %
A profitability ratio that calculates how efficiently a company is at generating profits from its revenue.
Gross Profit Margin %
A profitability ratio that measure how efficiently a company uses its cost of goods sold to produce and sell products profitably.
- Edit Account Details
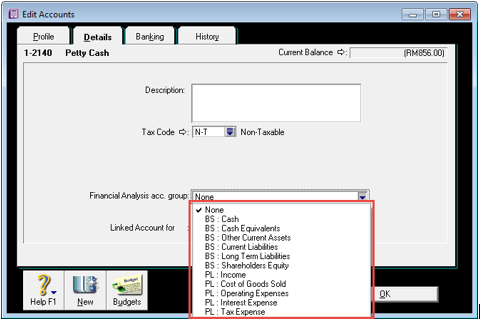
To use this report, user require to link relevant accounts to respective categories used in ratio analysis. This can be done via select the ‘Financial Analysis acc group’ in Edit Accounts > Details tab: (Refers to IMG003)
IMG003
User can select financial analysis account group from the dropdown list, then click OK to saved it.
To understand which category mapping requires, user may refer to formula stated in report, and mapped accordingly to get desires result.
Note: Capital Employed and EBITA are defined as:
Capital Employed = Long Term Liabilities + Shareholders Equity + Retained Earning + Current Earning
EBITA = Net Profit + Interest Expenses + Tax Expenses + Amortization
- Account List Detail Report
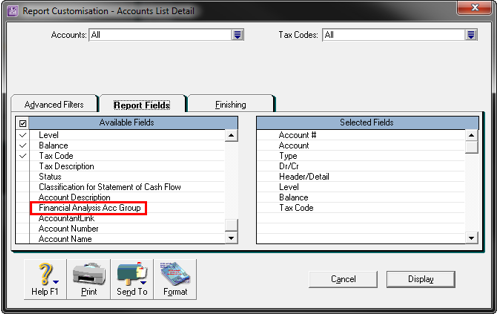
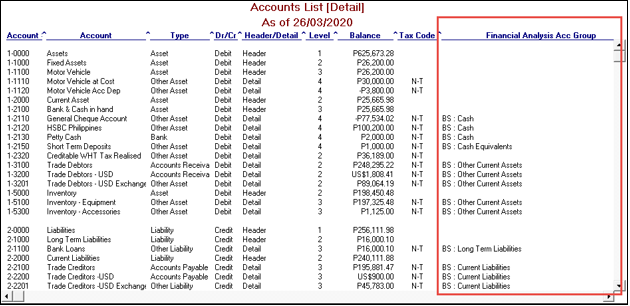
We have updated Account List Detail Report to include a new Report Field, ‘Financial Analysis Acc Group’. (Refers to IMG004)
IMG004
By including this field into report it will show the financial analysis account grouping that an account has associated with. (Refers to IMG005)
IMG005
- Import/Export Account Information
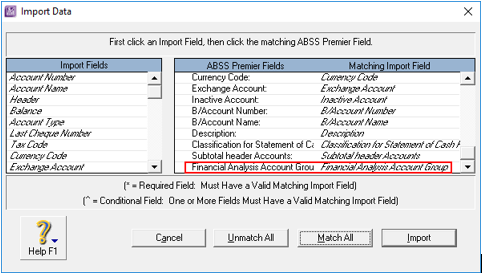
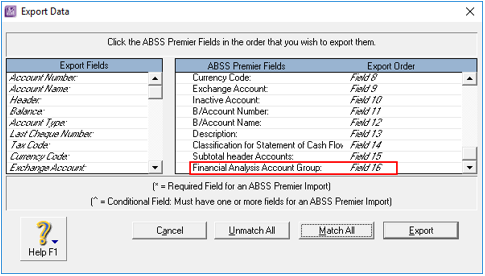
Import and Export Account functions has been updated with the new field Financial Analysis Account Group. (Refers to IMG006, IMG007)
IMG006
IMG007
- User Access
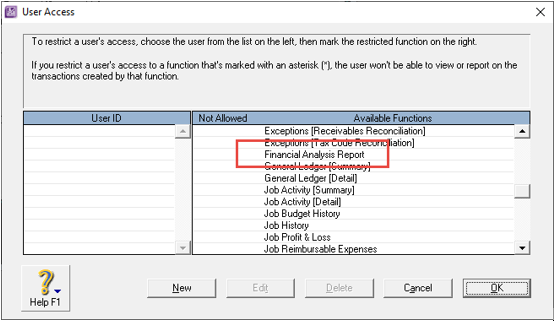
The User Access configuration screen has also updated with Financial Analysis Report function name for administrator to grant access right for normal user. (refer to IMG008)
IMG008
Comments
0 comments
Article is closed for comments.